Introduction
Today, I relocated my Proxmox Host and ESXi Host to the attic of my garage. Previously, both servers were situated in my home office, but the summer heat and constant noise became unbearable.
This post may contain affiliate links which means I receive a commission for purchases made through links. I only recommend products that I personally use! Learn more on my private policy page.
To keep an eye on both servers, I need to monitor their temperature and status closely.
Monitoring server temperatures is crucial for optimal performance and hardware longevity. This guide will walk you through setting up a temperature monitoring system on a Proxmox host using lm-sensors, Prometheus Node Exporter, and Grafana.
Installing Necessary Tools
On a fresh Proxmox installation, the following tools are necessary to monitor the CPU temperature.
But first, update the package list of your system:
sudo apt update
Install lm-sensors and mailutils:
sudo apt install lm-sensors mailutils bc
Detect sensors and configure them:
sudo sensors-detect
Follow the prompts to complete the configuration. Verify the installation by running:
sensors
For more detailed instructions, refer to the lm-sensors documentation.
The Monitoring Script
Use Nano (my favorite Editor) to make a new file:
nano /usr/local/bin/check_temp.sh#!/bin/bash
# Read the CPU temperature (Tctl)
CPU_TEMP=$(sensors | grep 'Tctl:' | awk '{print $2}' | sed 's/+//g' | sed 's/°C//g')
# Read the NVMe temperature (Composite)
NVME_TEMP=$(sensors | grep 'Composite:' | awk '{print $2}' | sed 's/+//g' | sed 's/°C//g')
# Default thresholds for warnings
CPU_MAX_TEMP=80
NVME_MAX_TEMP=70
# Check if the temperature values are not empty and are integers
if ! [[ "$CPU_TEMP" =~ ^[0-9]+(\.[0-9]+)?$ ]] || ! [[ "$NVME_TEMP" =~ ^[0-9]+(\.[0-9]+)?$ ]]; then
echo "Could not read temperatures. Check the sensors configuration." | mail -s "Temperature read failed" admin@example.nl
exit 1
fi
# Check the CPU temperature
if (( $(echo "$CPU_TEMP > $CPU_MAX_TEMP" | bc -l) )); then
echo "Warning: CPU temperature is too high: $CPU_TEMP°C" | mail -s "CPU temperature warning" admin@example.nl
fi
# Check the NVMe temperature
if (( $(echo "$NVME_TEMP > $NVME_MAX_TEMP" | bc -l) )); then
echo "Warning: NVMe temperature is too high: $NVME_TEMP°C" | mail -s "NVMe temperature warning" admin@example.nl
fi
Make your script executable with chmod:
chmod +x /usr/local/bin/check_temp.sh
Automating with Crontab
Use Crontab to frequently run the script. In this example every 5 minutes:
crontab -e# Edit this file to introduce tasks to be run by cron.
#
# Each task to run has to be defined through a single line
# indicating with different fields when the task will be run
# and what command to run for the task
#
# To define the time you can provide concrete values for
# minute (m), hour (h), day of month (dom), month (mon),
# and day of week (dow) or use '*' in these fields (for 'any').
#
# Notice that tasks will be started based on the cron's system
# daemon's notion of time and timezones.
#
# Output of the crontab jobs (including errors) is sent through
# email to the user the crontab file belongs to (unless redirected).
#
# For example, you can run a backup of all your user accounts
# at 5 a.m every week with:
# 0 5 * * 1 tar -zcf /var/backups/home.tgz /home/
#
# For more information see the manual pages of crontab(5) and cron(8)
#
# m h dom mon dow command
*/5 * * * * /usr/local/bin/check_temp.sh > /dev/null 2>&1
PATH=/usr/local/sbin:/usr/local/bin:/sbin:/bin:/usr/sbin:/usr/bin
MAILTO=""
Now it’s time to sending data to Grafana!
Sending Data to Grafana
To send the temperature data to Grafana (or to the Proxmox web interface), you will need to:
Install and configure Prometheus Node Exporter on the Proxmox host:
wget https://github.com/prometheus/node_exporter/releases/download/v1.3.1/node_exporter-1.3.1.linux-amd64.tar.gz
tar xvfz node_exporter-1.3.1.linux-amd64.tar.gz
sudo cp node_exporter-1.3.1.linux-amd64/node_exporter /usr/local/bin/
sudo useradd -rs /bin/false node_exporter
Create a systemd service file for Node Exporter:
sudo nano /etc/systemd/system/node_exporter.service
Add the following content:
[Unit]
Description=Node Exporter
After=network.target
[Service]
User=node_exporter
Group=node_exporter
Type=simple
ExecStart=/usr/local/bin/node_exporter
[Install]
WantedBy=default.target
Start and enable Node Exporter:
sudo systemctl daemon-reload
sudo systemctl start node_exporter
sudo systemctl enable node_exporter
Verify Node Exporter is running:
curl http://localhost:9100/metrics
Modify the script to send custom metrics to Prometheus: You can create custom metrics and expose them using Node Exporter. Modify your script to generate these metrics and then use Node Exporter’s textfile collector.
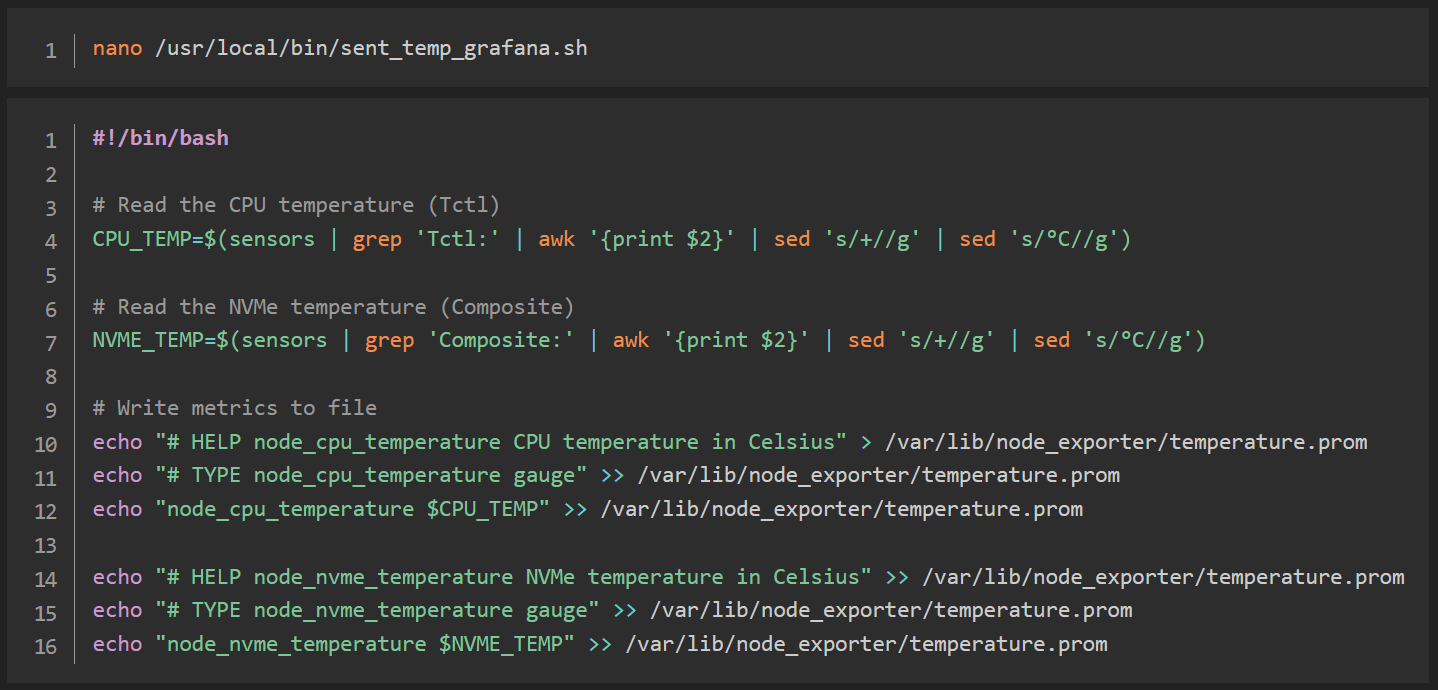
For example, modify your script (or make a new one) to write metrics to a file:
nano /usr/local/bin/sent_temp_grafana.sh#!/bin/bash
# Read the CPU temperature (Tctl)
CPU_TEMP=$(sensors | grep 'Tctl:' | awk '{print $2}' | sed 's/+//g' | sed 's/°C//g')
# Read the NVMe temperature (Composite)
NVME_TEMP=$(sensors | grep 'Composite:' | awk '{print $2}' | sed 's/+//g' | sed 's/°C//g')
# Write metrics to file
echo "# HELP node_cpu_temperature CPU temperature in Celsius" > /var/lib/node_exporter/temperature.prom
echo "# TYPE node_cpu_temperature gauge" >> /var/lib/node_exporter/temperature.prom
echo "node_cpu_temperature $CPU_TEMP" >> /var/lib/node_exporter/temperature.prom
echo "# HELP node_nvme_temperature NVMe temperature in Celsius" >> /var/lib/node_exporter/temperature.prom
echo "# TYPE node_nvme_temperature gauge" >> /var/lib/node_exporter/temperature.prom
echo "node_nvme_temperature $NVME_TEMP" >> /var/lib/node_exporter/temperature.prom
Make your script executable with chmod:
chmod +x /usr/local/bin/sent_temp_grafana.sh
Use Crontab to frequently run the script. In this example every 5 minutes:
crontab -e# Edit this file to introduce tasks to be run by cron.
#
# Each task to run has to be defined through a single line
# indicating with different fields when the task will be run
# and what command to run for the task
#
# To define the time you can provide concrete values for
# minute (m), hour (h), day of month (dom), month (mon),
# and day of week (dow) or use '*' in these fields (for 'any').
#
# Notice that tasks will be started based on the cron's system
# daemon's notion of time and timezones.
#
# Output of the crontab jobs (including errors) is sent through
# email to the user the crontab file belongs to (unless redirected).
#
# For example, you can run a backup of all your user accounts
# at 5 a.m every week with:
# 0 5 * * 1 tar -zcf /var/backups/home.tgz /home/
#
# For more information see the manual pages of crontab(5) and cron(8)
#
# m h dom mon dow command
*/5 * * * * /usr/local/bin/check_temp.sh > /dev/null 2>&1
*/5 * * * * /usr/local/bin/sent_temp_grafana.sh > /dev/null 2>&1
PATH=/usr/local/sbin:/usr/local/bin:/sbin:/bin:/usr/sbin:/usr/bin
MAILTO=""
Ensure Node Exporter reads the custom metrics file:
Edit the Node Exporter service to include the textfile collector directory:
sudo nano /etc/systemd/system/node_exporter.service
Modify the ExecStart line to include the textfile collector:
ExecStart=/usr/local/bin/node_exporter --collector.textfile.directory=/var/lib/node_exporter/
Restart the Node Exporter service:
sudo systemctl daemon-reload sudo systemctl restart node_exporter
Configure Prometheus to scrape the Proxmox host:
Add the Proxmox host to your Prometheus configuration (prometheus.yml):
scrape_configs:   - job_name: 'node_exporter_proxmox'
    static_configs:
      - targets: ['your_proxmox_host:9100']
Reload Prometheus configuration:
curl -X POST http://localhost:9090/-/reload
Add the Prometheus data source in Grafana:
- Go to your Grafana web interface.
- Navigate to
Configuration->Data Sources. - Add a new Prometheus data source with the URL of your Prometheus server.
Create a dashboard in Grafana:
- Create a new dashboard.
- Add a new panel with a graph visualization.
- Set the query to
node_cpu_temperatureandnode_nvme_temperature.
This setup will allow you to monitor your Proxmox host’s temperatures in Grafana using Prometheus and Node Exporter.
Copyright © 2024 Sluijsjes Tech Lab